


The
structure
of
the
database
has
been
divided
into
three
sections,
described
in
the
data
analysis:
flora,
ecology
and
production.
The database is built with the software -RDBMS File Maker – which has proven efficient and relatively easy to use.
The
difficulty
encountered
in
structuring
the
database
stems
from
the
fact
that
vegetation
types
are
sometimes
plant
combinations
whose
characteristics
result
from
the
statistical
analysis
of
the
vegetation
and
the
observation
of
the
environment,
summarized
in
tables,
and
sometimes
mosaics
of
plant
combinations.
In
the
original
study
(DELMASIG
:
J.
Marie,
2000),
we
provided
only
the
characteristics
of
the
plant
combinations.
We
therefore
had
to
define
what
a
mosaic
represents
and
what
corpus
of
rules
should
be
applied
to
compose
the
floristic,
ecological
and
production
characteristics
of
these
mosaics.
With
the
exception
of
MB,
treated
separately
because
of
its
complexity,
the
codes
used
for
the
mosaics
are
formed
by
the
juxtaposed
acronyms
of
two
elementary
plant
combinations
(e.g.
VOR/VH).
When
the
two
plant
combinations
indicated
are
ecologically
close,
because
they
belong
to
the
same
level
of
flooding
or
to
adjacent
ones,
the
code
is
that
of
a
binary
mosaic
constituted
by
the
two
indicated
plant
combinations.
By
convention,
the
order
in
which
the
combinations
are
indicated
places
first
the
one
corresponding
to
the
deepest
flood.
If
the
combinations
have
the
same
flood
level,
alphabetical
order
prevails.
For
PAN,
PAR,
PAS,
which
are
flooded
by
local
run-off
and
sometimes
by
late
river
flooding,
the
convention
has
been
adapted
as
follows.
If
one
of
these
three
associations
enters
into
the
composition
of
a
mosaic
with
a
combination
that
is
regularly
flooded,
the
latter
association
prevails.
Thus
P
(level
3
]-0.10
-
0.30])
combined
with
PAN
(level
4
]-0.30
-0.60
])
is
written
P/PAN
and
not
PAN/P,
according
to
the
depth
of
flood.
On
the
other
hand,
if
the
associations
flooded
by
run-off
and
late
river
flood
are
combined
to
a
dry
savanna
combination
(type
TA,
TB,
...),
the
mosaic
is
written
in
the
order
of
decreasing
flood
levels
(e.g.
PAN/TA).
For
wide-gradient
mosaics,
that
is
to
say,
when
the
two
associations
indicated
belong
to
distant
flood
levels,
the
indication
is
only
a
shortcut
to
note
a
more
complex
mosaic
in
which
not
only
the
indicated
combinations
but
also
others
with
intermediate
flood
regimes,
participate.
For
example,
B/VSP
is
a
shortcut
to
indicate
a
mosaic
that
includes,
in
addition
to
B
and
VSP,
plant
combinations
such
as
EOR,
O,
VOR.
The
difficulties
were
solved
by
determining
the
characteristics
of
the
mosaic
on
the
basis
of
those
of
the
component
combinations.
Calculation
rules
have
been
defined
so
that
this
can
be
done
systematically
and
automatically
on
the
basis
of
the
codes
given
to
the
combinations
and
their
mosaics. However, these rules may differ, depending on the nature of the information processed.
The
principle
that
guided
the
structuring
of
the
thematic
information
is
to
separate
the
attributes
of
the
28
basic
plant
associations
(with
MB)
from
the
attributes
assessed
for
the
mosaics
of
associations
that
are
derived
from
that
of
the
component
plant
associations.
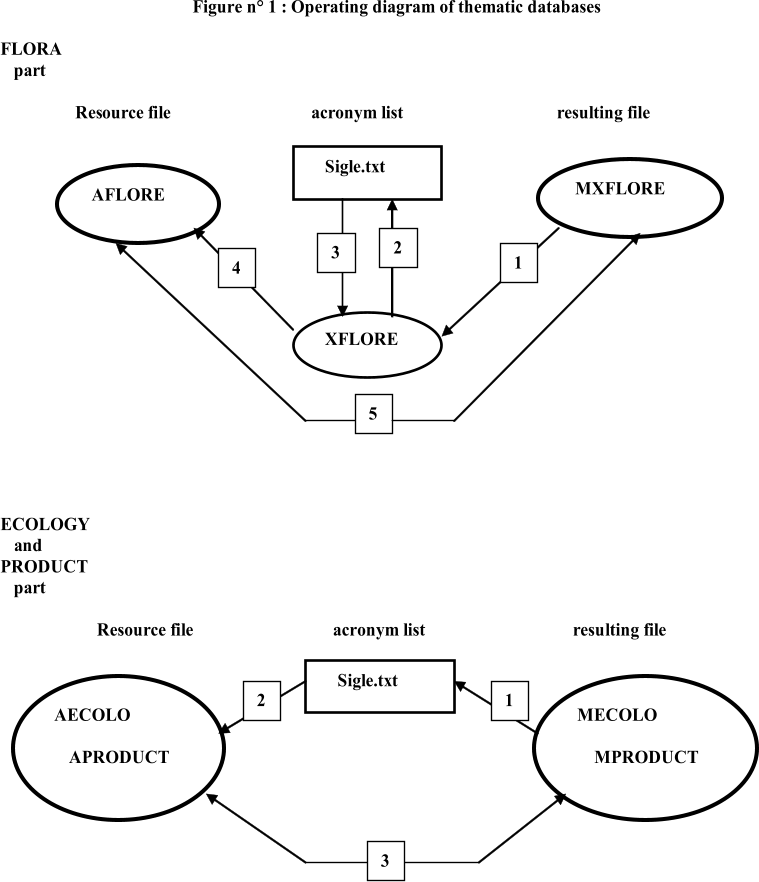
The
relationship
between
the
source
file
and
the
resulting
file
is
performed
via
a
text
file
called
sigle.txt
that
lists
the
acronyms
of
the
120
vegetation
types
(including
TB/TC,
treated
as
a
vegetation
type)
by
alphabetical
order.
When
a
mosaic
composition
is
launched,
the
program
reads
the
file
sigle.txt
containing
the
acronyms.
For
each
acronym,
it
draws
the
necessary
resources
from
the
source
file
and
composes
the
mosaic
by
computing
each
field
according
to
the
pre-established
rules.
An
acronym
with
a
single
plant
association
is
treated
as
a
mosaic
of
identical
plant
associations.
Special
"scripts"
allow
us
to
compose
tiles
by
unit, by entering the acronym "by hand", which is convenient for tests.
However, these rules may differ, depending on the nature of the information processed :
1
-
For
the
floristic
composition
of
the
mosaics,
it
was
decided,
regardless
of
the
nature
of
the
mosaic
(binary
or
complex
type),
that
the
flora
of
the
mosaic
would
be
a
simple
"addition"
of
the
floristic
compositions
of
the
component
combinations.
The
contribution
of
species
to
the
vegetation
mass
is
calculated
as
the
average
contribution
within
each
combination
listed
in
the
mosaic.
In
the
case
of
a
complex
mosaic,
the
presented
floristic
profile
is
thus
a
"shortcut",
taking
into
account
only
the
"starting"
and
the
"ending"
plant
associations.
This
simplification
of
information
dispenses
with
what
would
have
been,
in
particular
for
some
mosaics,
long
floristic
lists
with
low
contributions
of
each
species.
Similarly,
the
indicator
value
of
the
presence/absence
of
each
species
in
the
floristic
profile
of
the
association
was
abandoned
in
the
case
of
mosaics,
as
being
meaningless
in
this
case.
On
the
other
hand,
the
status of a species in the mosaic is the highest status in each of the two associations (dominant/accompanying/occasional).
2
-
For
production
variables,
which
are
all
quantitative,
we
also
decided
that
the
values
adopted
for
the
mosaics
would
be
simple
arithmetic
means
of
the
values
of
the
variables
of
the
two
component
associations.
Systematic
tests
for
complex
mosaics
were
carried
out
with
alternative
methods,
taking
into
account
the
intermediate
association
values.
The
differences
observed
were
marginal
and
did not justify the adoption of such methods.
3
-
For
ecological
variables,
however,
we
decided
to
take
into
account
the
real
complexity
of
the
mosaics.
When
the
two
characterizations
of
the
mosaic
belong
to
the
same
flood
level
or
two
consecutive
ones,
that
of
the
mosaic
is
obtained
by
a
simple
"average"
-
in
fact
a
combination
of
indices
as
set
out
in
the
table
below
–of
the
characterizations
of
each
component
associations.
On
the
other
hand,
when
the
two
associations
belong
to
different
and
non-consecutive
flood
levels,
the
"average"
takes
into
account
the
intermediate
levels.
For
example,
if
the
two
associations
belong
to
flood
levels
are
distant
from
one
level,
the
"mean"
is
established
for
the
characters
of
each
of
the
two
associations
indicated,
and
also
those
of
the
intermediate
level,
with
equal
weight
given
to
each
component,
which
therefore
participates
as
one
third
to
the
mosaic.
In
the
previous
example,
the
B/VSP
mosaic
must
be
understood
as actually the B/LEVEL 5/VSP mosaic in which LEVEL 5 is a mosaic summarizing EOR/O/VOR.
The
complexity
of
the
mosaics
is
therefore
taken
into
account
in
the
indexed
ecological
profiles.
Probability
profiles
are
obtained
by
following
empirical
rules
already
used
by
Pierre
Hiernaux
for
the
determination
of
indexed
floristic
profiles
(eg
BP)
from
the
probabilistic
indexed
relationships
linking
a
plant
species
(e.g.
Echinochloa
stagnina
)
and
a
state
of
the
variable
(e.g.
flood
depth class).
The combinatory results from the use of the following matrix as indicated in
Table 1
Are replaced by a numerical code: +++ code 4; ++ code 3; + code 2; • code 1; 0 code 0

GIS organization (2)
CREATION OF THEMATIC DATA
The
resulting
file
is
always
in
command:
the
system
was
imagined
and
implemented
by
Isabelle
Louise
Bisson.
It
was
designed
so as to make it possible to update that part of the GIS in several different ways :
1
-
the
"source"
file
may
be
modified
by
adding
files
for
new
plant
associations,
as
long
as
the
acronyms
used
are
alphanumerical codes of no more than 3 characters
2 -
without adding new files, it is possible to modify any value related to an existing association file
3 -
should VEG4 be changed when updated, new mosaics could be composed simply by modifying the sigle.text list of mosaics.
Example of a file processed in MX FLORE :

MECOLO file with the names of the items in the database (see page 37 "Ecological variables")
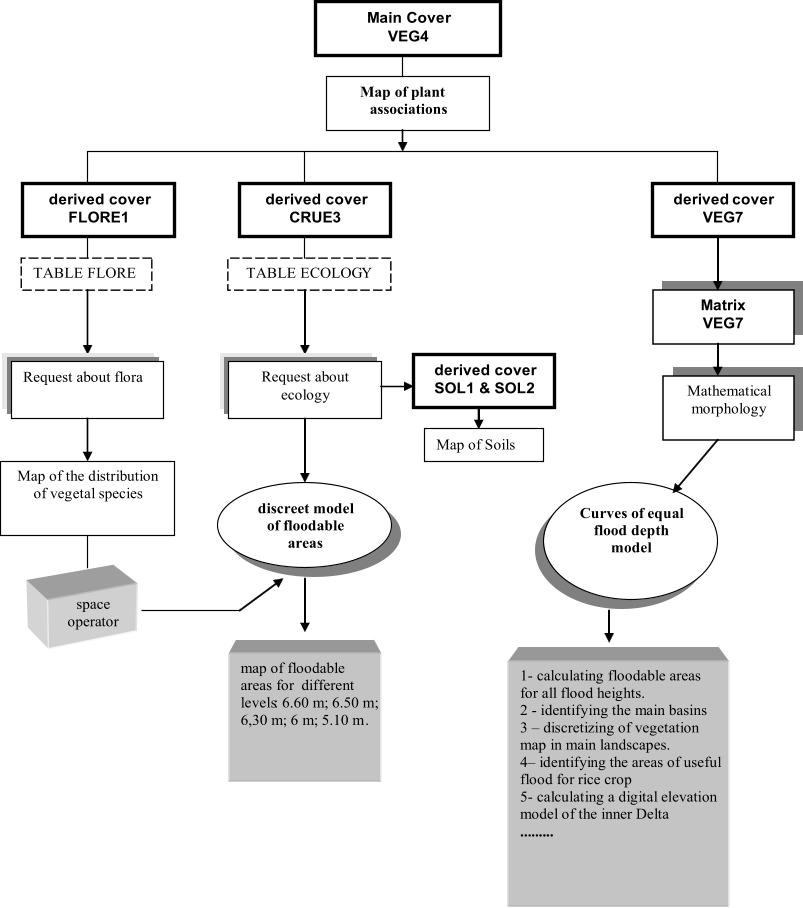


Figure 2 : GIS organization for the vegetation part